 |
Our Technologies
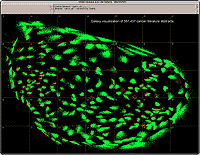 | Galaxies
Concept: The Galaxies visualization uses the image of stars in the night sky to represent a set of documents. Each document is represented by a single "docustar." Closely related documents cluster together while unrelated documents are separated by large distances. Several analytical tools are provided with Galaxies to allow users to investigate the document groupings, query the document contents, and investigate time-based trends.
Status: The Galaxies visualization is deployed as part of the SPIRE information visualization tool suite. |
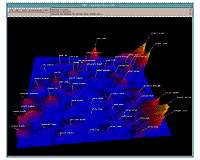 | ThemeViewTM *
Concept: In the ThemeViewTM visualization, the topics or themes within a set of documents are shown as a relief map of natural terrain. The mountains in the ThemeViewTM indicate dominant themes. The height of the peaks indicates the relative strengths of the topics in the document set. Similar themes appear close together, while unrelated themes are separated by larger distances. ThemeViewTM provides a visual overview of the major topics contained in a set of documents. Combined with its exploration tools, ThemeViewTM permits the analyst to identify unanticipated relationships and examine changes in topics over time.
* Note: "ThemeViewTM " was formerly known as Themescape.
Status: The ThemeViewTM visualization is deployed as part of the SPIRE information visualization tool suite.� |
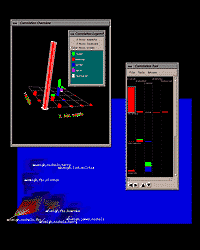 | Correlation Tool
Concept: The correlation tool gives users the power to examine relationships among user-defined variables.In concert with the Galaxies and ThemeViewTM visualizations, the correlation tool illustrates co-occurrence of various categories of information. For example, users may develop a list of locations of interest and a list of events of interest, then use the correlation tool to rapidly identify which events correspond with which locations.
Status: The Correlation Tool is deployed as part of the SPIRE information visualization tool suite.� |
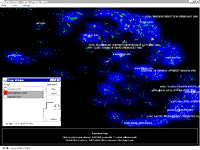 | WebThemeTM
Concept: WebThemeTM is a web-enabled version of SPIRE that provides a new way to investigate and understand large volumes of textual information. It has the ability to harvest data from the World Wide Web using search terms, or by following links derived from user specified URLs. Users can rapidly identify themes and concepts found among thousands of pages of text, and then further explore areas of interest.
Status: WebThemeTM is currently under development. |
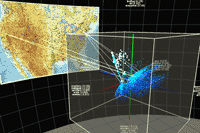 | Starlight
Concept: The STARLIGHT information model is uniquely flexible and powerful. STARLIGHT uses an advanced, object-oriented approach that is much more conducive to exploratory information analysis than are typical relational data models. Additionally, the STARLIGHT information model is capable of tightly integrating disparate, multiformat (and multimedia) information and data, enabling their concurrent analysis. Further, the model captures interrelationships among database elements and their properties in a way that more effectively mirrors the true nature of most problem domains than do other approaches.
Status: More details about Starlight can be found on its home page.
|
 | Rainbows
Concept: Rainbows is a method for visually exploring multiple kinds of relationships among entities. One of the strengths of this visualization is the way that it portrays three different classes of relationships. Entities (perhaps documents, perhaps people or concepts) are represented as small dots on a two-dimensional plane. Their location represents a summarization of one kind of relationship among them. A second class of relationship is shown as arcs above the plane. A white arc between two clusters indicates that such a relationship exists between entities within the clusters. The white arc can be expanded to show multiple colors (as in the spectrum), each indicating existence of a particular kind of relationship within this class. A third class of relationship is shown as arcs below the plane. Interactions allow the user to display relationships for particular entities, to display relationships of a given type, and to progressively show more detail about particular relationships.
Status: An interactive proof of concept prototype has been developed. |
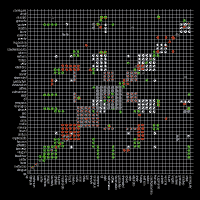 | Connex
Concept: The Connex visualization tool displays individual relationships among a collection of entities, such as documents or concepts within documents. In this visualization, the x and y axes both correspond to an ordered list of entities. The z axis corresponds to the various types of relationships that occur in this subset. If an entity has a particular relationship to another entity, then a small bead shape in that z-plane will correspond to the intersection of the two entity planes. If the entities have multiple relationships there will be several such beads - perhaps a stack of beads - at various z-positions. The tool allows the user to categorize the various relationships, hide or show particular relationships at will, highlight asymmetric relationships, and reorder the document display. Colors can be assigned to categories to help group or distinguish different relationships.
Status: An interactive proof of concept prototype has been developed. |
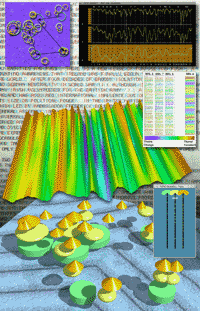 | TOPIC ISLANDSTM
Concept: TOPIC ISLANDSTM presents a novel approach to visualize and explore unstructured text. The underlying technology, called TOPIC-O-GRAPHYTM, applies wavelet transforms to a custom digital signal constructed from words within a document. The resultant multi-resolution wavelet energy is used to analyze the characteristics of the narrative flow in the frequency domain, such as theme changes, which is then related to the overall thematic content of the text document using statistical methods. The thematic characteristics of a document can be analyzed at varying degrees of detail, ranging from section-sized text partitions to partitions consisting of a few words. Using this technology, we are developing a visualization system prototype known as TOPIC ISLANDSTM to browse a document, generate fuzzy document outlines, summarize text by levels of detail and according to user interests, define meaningful subdocuments, query text content, and provide summaries of topic evolution.
Status: We have a functioning first prototype. In 1997, we applied for a U.S. patent for the TOPIC-O-GRAPHYTM technology.
Additional information about TOPIC ISLANDSTM is available on the TOPIC-O-GRAPHYTM Web Site. |
 | Hypercube
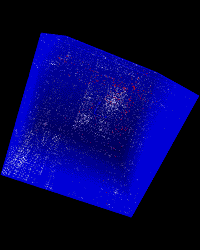
Concept: The HyperCube provides a framework in which a semi-static information structure can be represented. This allows an analyst to quickly locate information objects of particular interest in a predictable location-- usually for more detailed analysis in another visualization tool.
The HyperCube representation identifies the top 100 concepts contained in an information object. These concepts are drawn from a set of standard terms, which make up the axes.
Status: Under development. |
 | Cosmic Tumbleweed
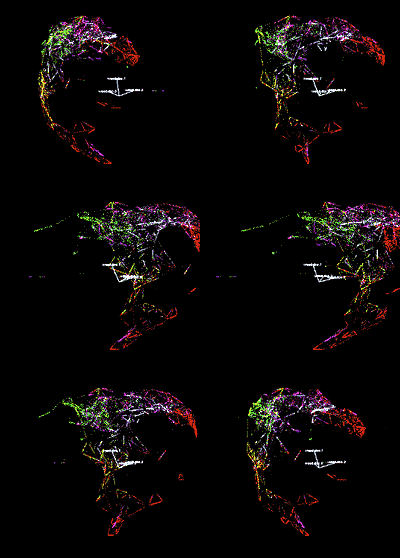
Concept: The Cosmic Tumbleweed is a topic-based projection. Instead of creating vectors for the documents (as in the case of Galaxies, for example), we create 3-D vectors for the topics in the dataset. We then interpolate the documents between the topics, based upon the two (or three) most important topical components of each respective document.
Status: Currently being researched. |
 | Fractal Projections�
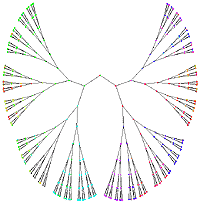
Concept: Information is organized and viewed as fractal spaces. Such spaces are considered because the spaces are intrinsically different from the Euclidean space usually considered and the spaces are viewable on computer screens. The initial class of fractals being used are Iterated Function System fractals. A variant of self-organizing maps is used to carry out the projection.
Status: The technology is currently in testing.� |
 | Starstruck
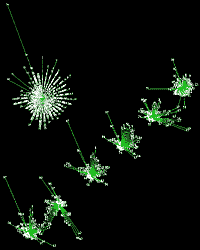
Concept: The Starstruck visualization was intended to meet two goals: 1) represent differing levels of granularity in information spaces and 2) give meaning to the shape of clusters in the information space.
In the Starstruck visualization, each document is represented as a planar starburst of topic rays. The length of each ray indicates the strength of the corresponding topic or theme in that document. The order of the theme rays from the 12 o'clock position clockwise is the same for each document; they are ordered such that themes that tend to occur together in the document collection will be near each other in the planar starburst, making it easier to identify areas of theme strength and theme weakness.
The visualization is intended to show thematic patterns over a group or cluster of documents. The individual planar starbursts for the group are aligned along an invisible rod in space. When the view is changed to look down that rod, all the starbursts are shown superimposed and the shape of the group representation gives a clear impression of the thematic distribution within that group. By varying the view rotation, the user can switch from seeing the thematic strengths of the group as a whole to panning over individual documents.
Status: An interactive proof of concept prototype has been developed. |
 | MediSense
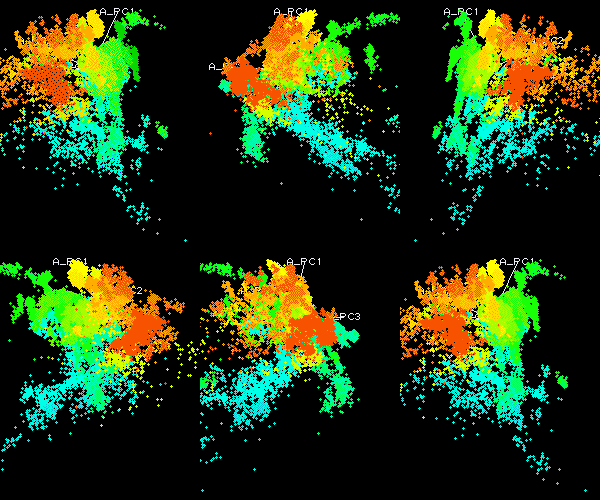
Concept: MediSense is a revolutionary idea to apply analogous visualization techniques, such as those used by SPIRE to browse large document collections, to visualize high resolution temporal data. A custom feature extraction engine is used to build a high-dimensional data vector for each patient across sensors for each patient heartbeat in the data record. Dimensionality reduction techniques are then used on this vector to permit a holistic view of the patient's status, (for example, after surgery), that a medical professional may browse.
Status: A proof-of-concept project was completed for the U.S. Army in conjunction with Walter Reed Institute of Research, Department of Surgery. In this project, visualizations for three patients were built using 3 to 4 four hours of 1000 Hz data from three sensors that measured heart, lung, and blood pressure activity. |
 | CATCH
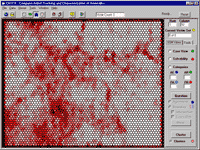
Concept: CATCH, Computer Aided Tracking and Characterization of Homicides, is a collection of tools that assist the crime analyst in the investigation process. The Artificial Neural Network (ANN) employed in CATCH learns about existing crime cases in the database of the Homicide Investigation Tracking System (HITS) Unit of the Washington State Attorney General's office. It uses parameters identified as modus operandi (MO) and signature characteristics of the offender. The ANN clusters cases containing similar signature elements, and to a lesser degree MO elements, into groups. The proximity of cases within the ANN allows the analyst to compare one case to others within the database.
Status: CATCH is currently under development. More information is available from a CATCH White Paper. (page will load into a new browser window) |
Pacific Northwest National Laboratory is operated for the United States Department of Energy by Battelle Memorial Institute. Standard disclaimer applies. Comments welcome at infoviz@pnl.gov.
Page last updated March 31, 1999.
|


